In Phase 6, we explored the power of listening, how meaningful feedback from learners, gathered through pulse surveys, interviews, and analysis, fuels continuous improvement and ensures that learning resonates in real-world settings. But feedback alone doesn’t complete the picture. The next critical step is translating those voices into measurable change. In this final phase, we move beyond perceptions and experiences to look at what really matters: how learning shifts behavior, improves performance, and delivers business outcomes.
To show the real value of learning, we need more than completion rates; we need performance evidence.
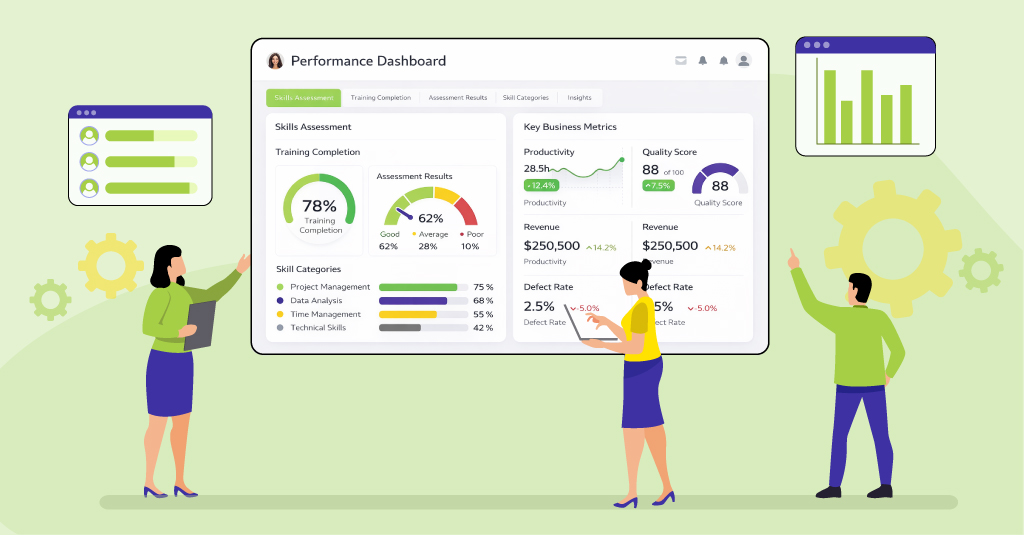
Learning shouldn’t just be a good experience. It should lead to real shifts in behavior, performance, and outcomes. In this section, we explore how to capture and use solid, actionable data to show that change is happening and to guide what we do next.
Compare Pre and Post-Training Performance Metrics
One of the most effective ways to track impact is by comparing what was happening before and after the training. The idea is to define a few key indicators that truly matter, then monitor how they change after the intervention.
These indicators might include:

Sales conversion rates
Customer satisfaction scores


First-time resolution or error rates
Time to complete tasks


Compliance or safety incidents
Sales conversion rates
Customer satisfaction scores
First-time resolution or error rates
Time to complete tasks
Compliance or safety incidents
By working closely with business stakeholders, we help you define the right metrics up front. After the launch of the learning intervention or program, we revisit those same metrics to assess improvement.
Here is a step-by-step set of activities on how this can be approached.
| Section | What to Do | What to Track | What Change to Observe | What to Do |
|---|---|---|---|---|
| Identify Priority Outcomes |
Start by clarifying the performance outcomes learning is expected to influence. |
Business KPIs (e.g., sales, customer satisfaction, quality) |
Clear linkage between business needs and learner performance |
Strategy docs, stakeholder interviews (focus group discussions) |
| Choose Specific Metrics |
Pick 2–3 measurable indicators that align with the expected impact. |
E.g., Conversion Rate, Error Rate, Resolution Time |
Quantifiable improvement post-training |
CRM, QA Dashboards, Productivity Reports |
| Establish a Baseline |
Gather pre-training data to create a starting point for comparison. |
Average past performance over 1–3 months |
Clear snapshot of “before learning” |
System logs, internal systems, manual records |
| Track Post-Training Data |
Measure performance after the learning intervention. |
Same indicators as baseline |
Increase in accuracy, speed, engagement, or quality |
Automated reports, LMS, self-reports |
| Monitor % Change |
Calculate improvement (or drop) to determine real-world impact. |
% improvement or regression |
Ideal expected shift, depending on context |
Data comparison over time |
| Cross-Validate with Feedback |
Support the numbers with feedback from learners and managers. |
Application stories, confidence scores |
Alignment of behavior change with numbers |
Surveys, interviews, manager check-ins |
| Report and Refine |
Summarize insights, identify trends, and adjust learning as needed. |
Combined quantitative + qualitative insights |
Continuous improvement loop |
Dashboards, reports, debrief meetings |
Conduct Impact Assessment
Now that we’ve looked at how to identify and track performance metrics, it’s time to take a broader view of how impact should be interpreted. Performance data tells us what has changed, but to understand why it changed, and how the learning contributed to it, we need a more layered approach.
Impact isn’t just about numbers or behavior shifts. It’s also about what learners think, how they feel, what they remember, and how consistently they apply their learning on the job. That’s why we consider a 360° view of effectiveness as opposed to a short-sighted view.
We draw inspiration from Kirk-Patrick’s Four Levels that help us ask the right questions:
| Level | What It Tells Us | Typical Tools |
|---|---|---|
| Reaction | Did learners find the training engaging, relevant, and worthwhile? | Post-session surveys, Liker-scale ratings, quick polls |
| Learning | Did they gain the intended knowledge, skills, or attitudes? | Pre-/post-assessments, confidence ratings, quizzes |
| Reaction | Are they applying the learning at work? What’s changed in how they do their job? | Manager feedback, peer observations, learner stories |
| Learning | Has this learning contributed to improved performance or business outcomes? | KPI comparisons, quality metrics, productivity reports |
Impact assessment bridges the gap between training and tangible business value, giving us the insights we need to evolve future programs and show stakeholders that learning truly delivers results.
Segment Data for Deeper Insights
Important patterns can sometimes remain inconspicuous in overall averages. Here is where breaking down data into smaller segments helps, either by department, role, experience level, or location. This helps identify who the intervention is working for and who might need more support.
For instance, entry-level employees might show strong gains, while mid-level managers may struggle to apply certain concepts. By comparing cohorts, we can tailor follow-ups and refinements more effectively.
Identify Trends, Gaps, and Opportunities for Improvement
Once we’ve collected and segmented the data, it’s time to synthesize what it all means. Patterns across multiple interventions can point to systemic strengths or recurring gaps.
1.
Is one skill area always underperforming?
2.
Are certain teams consistently disengaged?
3.
Are follow-up resources helping, or going unused?
These insights inform how we evolve our strategy, by targeting specific skills, redesigning certain modules, or even introducing manager coaching.
Track and Record Impact Stories
Sometimes numbers don’t tell the whole story. That’s where real stories, shared by learners, managers, or teams, add rich, human, practical insight into how learning is impacting real work.
We collect these through structured interviews or open-ended post-training questions. These narratives build credibility, spark buy-in and help demonstrate value to leadership.
Here is a practical format for how impact stories can be requested and captured.
| Story Element | Description | Example / Notes |
|---|---|---|
| Background Context | Describe the learner’s role, team, and the business problem or opportunity. | “A mid-level sales executive struggling with low client conversion rates.” |
| Learning Experience | Summarize the learning program or intervention the individual participated in. | “Completed a 2-week blended learning program on consultative selling techniques.” |
| Application of Learning | Explain how the learner applied the knowledge or skills in their work context. | “Started using open-ended questioning techniques during client meetings.” |
| Outcome / Result | Show the measurable or observed change in performance or behavior | “Client conversion rate increased from 10% to 16% in two months.” |
| Business Impact | Link the change to a broader organizational benefit. | “This contributed to a ₹3.2 lakh boost in quarterly regional sales.” |
| Human Story Element | Share a quote, emotion, or realization that brings authenticity to the story. | “I didn’t just learn new techniques—I finally understood what clients really value.” |
These stories can be turned into testimonials, shared in newsletters, or featured in leadership briefings to show real-world transformation.
Track and Record Impact Stories
When we measure what really matters, behavior, performance, and stories, we move beyond surface-level engagement. We build a true case for learning as a driver of business performance, employee growth, and cultural transformation. But impact isn’t a checkbox; it’s a continuum.
To deeply embed it, we must go beyond delivering content; we must design with intent, and with a strategy that keeps learning alive in the flow of work. And that’s where our design approach matters. In the next chapter, we’ll explore two practical, flexible pathways to help you design for real-world, sustained impact, no matter your learning context or business need.
When we measure learning by the difference it makes, not just by completion rates, but through clear behavioral shifts and business performance, we show its true value. From tracking hard metrics to capturing impact stories, Phase 7 wraps up the journey with the insights that matter most. But to truly embed learning impact across your organization, it takes a cohesive, strategic approach. Download our eBook, Beyond Training: An Actionable Guide to Learning That Delivers Measurable Business Impact, and explore all seven phases of the Learning Impact Framework in one place, complete with practical tools, examples, and templates to drive lasting results.


